DC Traffic Fatalities
Introduction
In this analysis, we look at traffic fatalities in the District of Columbia, particularly pedestrian deaths.
The data contains 1242 fatalities since 1995, though we only have mode breakdowns starting 2011, and Ward information starting in 2017.
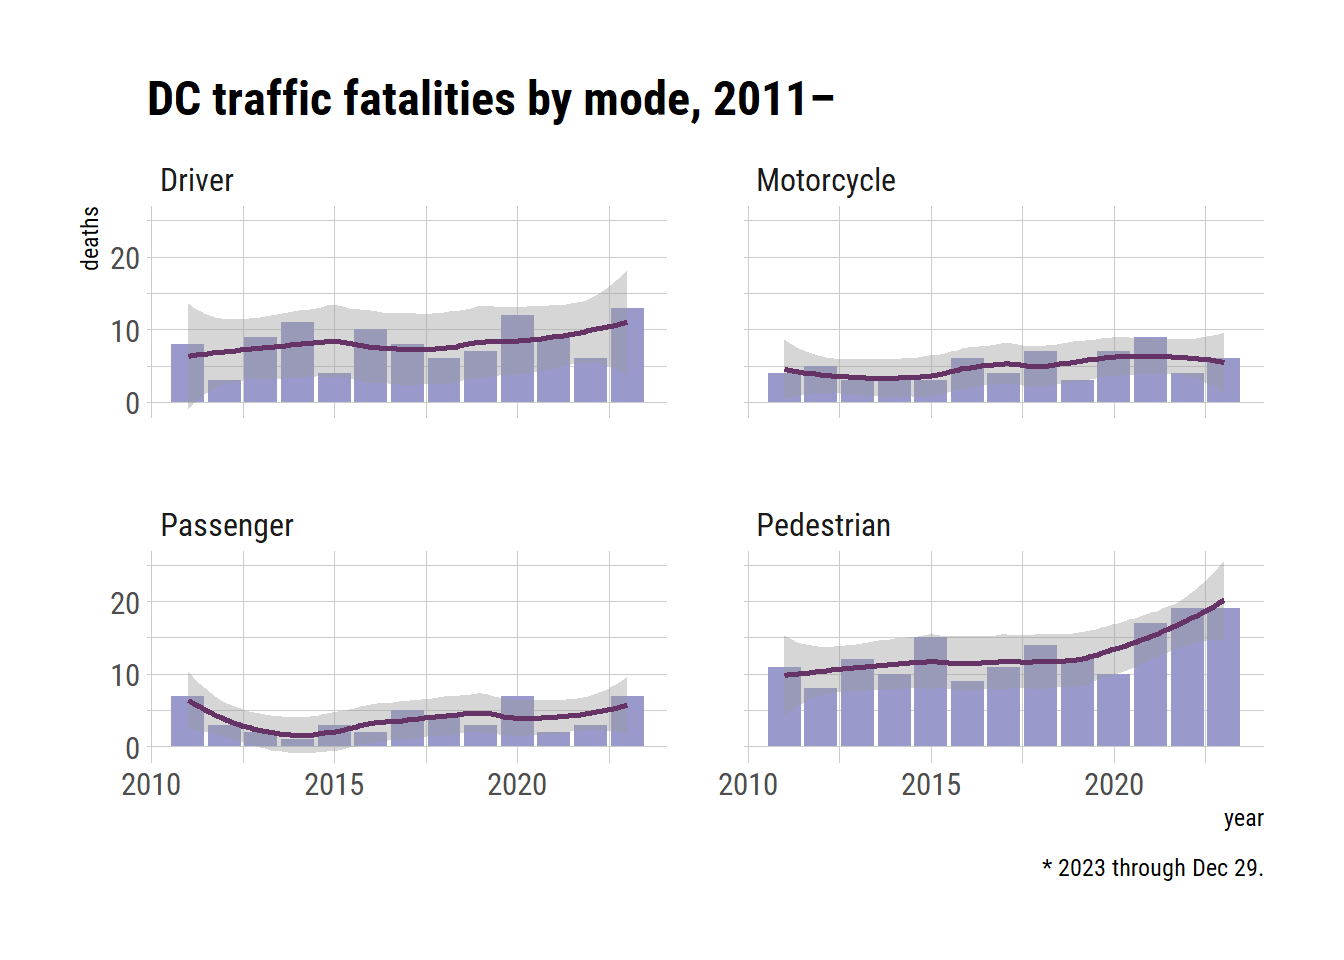
Of 415 DC traffic deaths since the beginning of 2011, at least 167 (40.24%) have been pedestrians, at least 106 (25.54%) have been drivers, and at least 49 (11.81%) have been passengers in motor vehicles. 24 (5.78%) have been hit while riding bicycles.
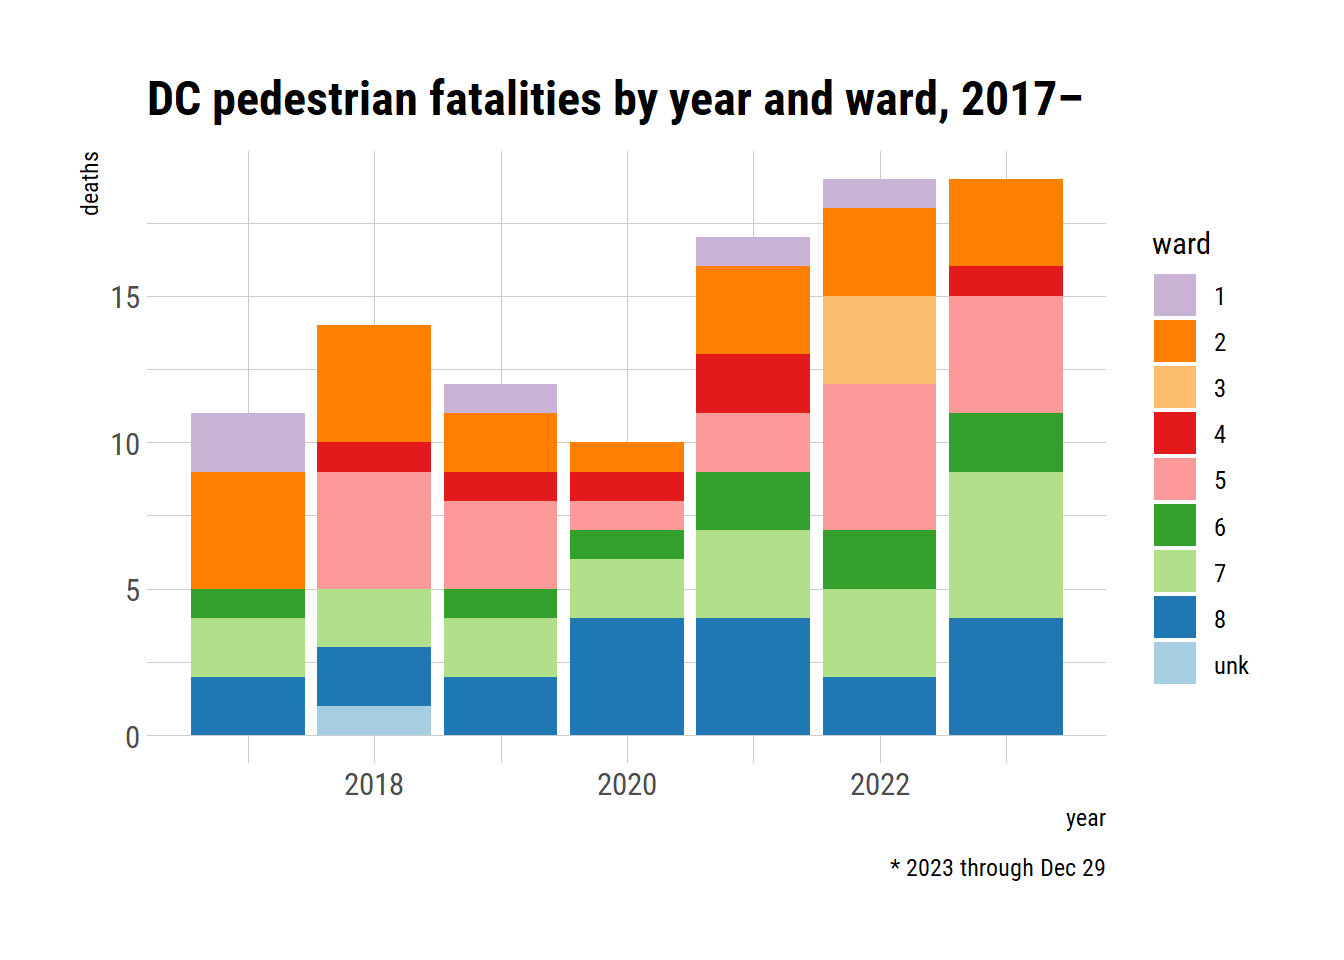
Of 251 DC traffic deaths since the beginning of 2017, at least 9 (3.59%) have occurred in Ward 1, 35 (13.94%) have occurred in Ward 2, 6 (2.39%) have occurred in Ward 3, 17 (6.77%) have occurred in Ward 4, 47 (18.73%) have occurred in Ward 5, 28 (11.16%) have occurred in Ward 6, 51 (20.32%) have occurred in Ward 7, and 58 (23.11%) have occurred in Ward 8.
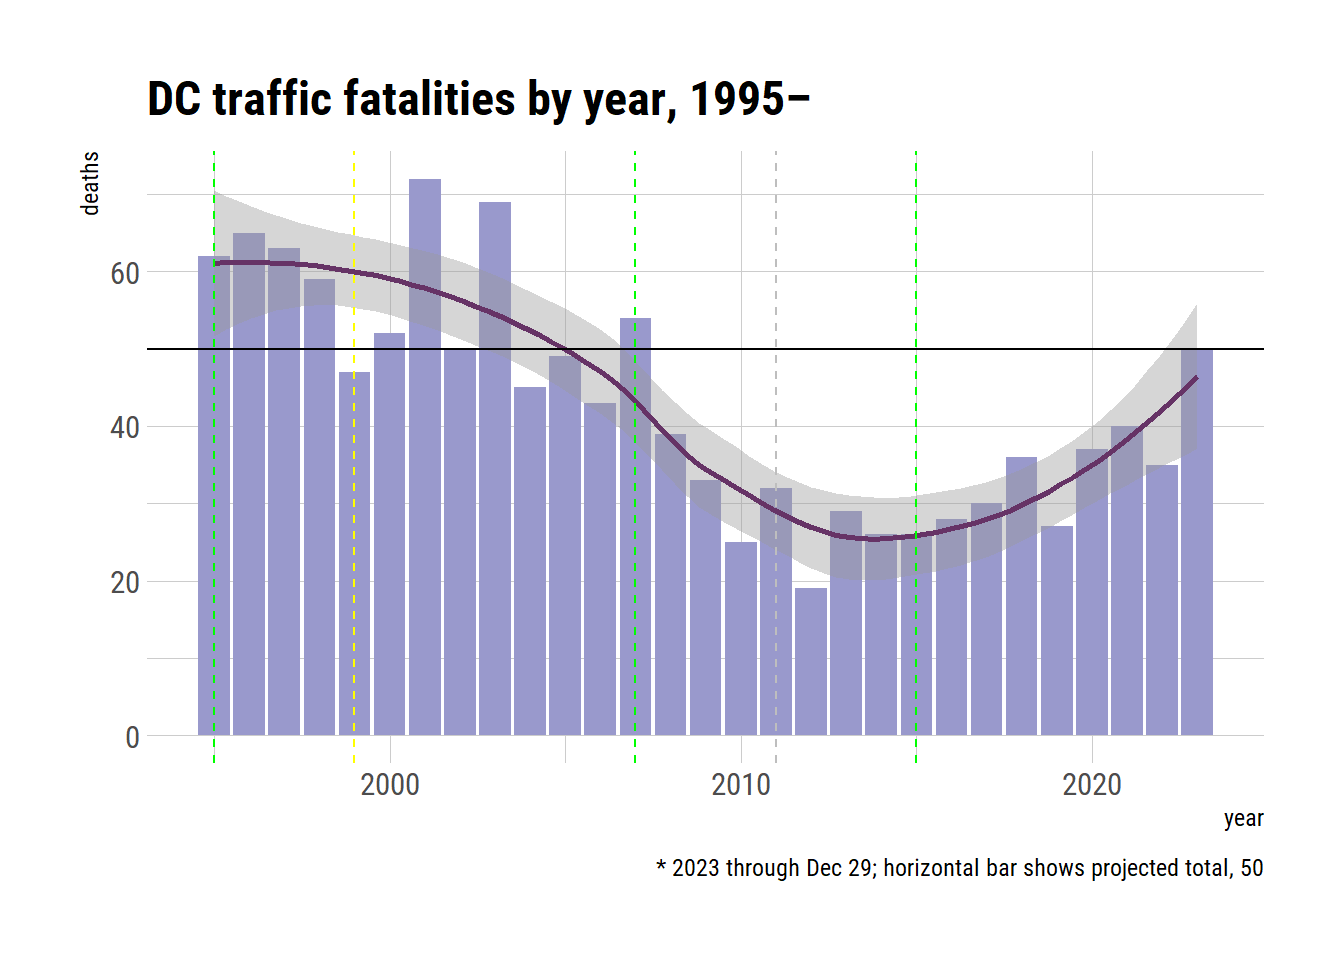
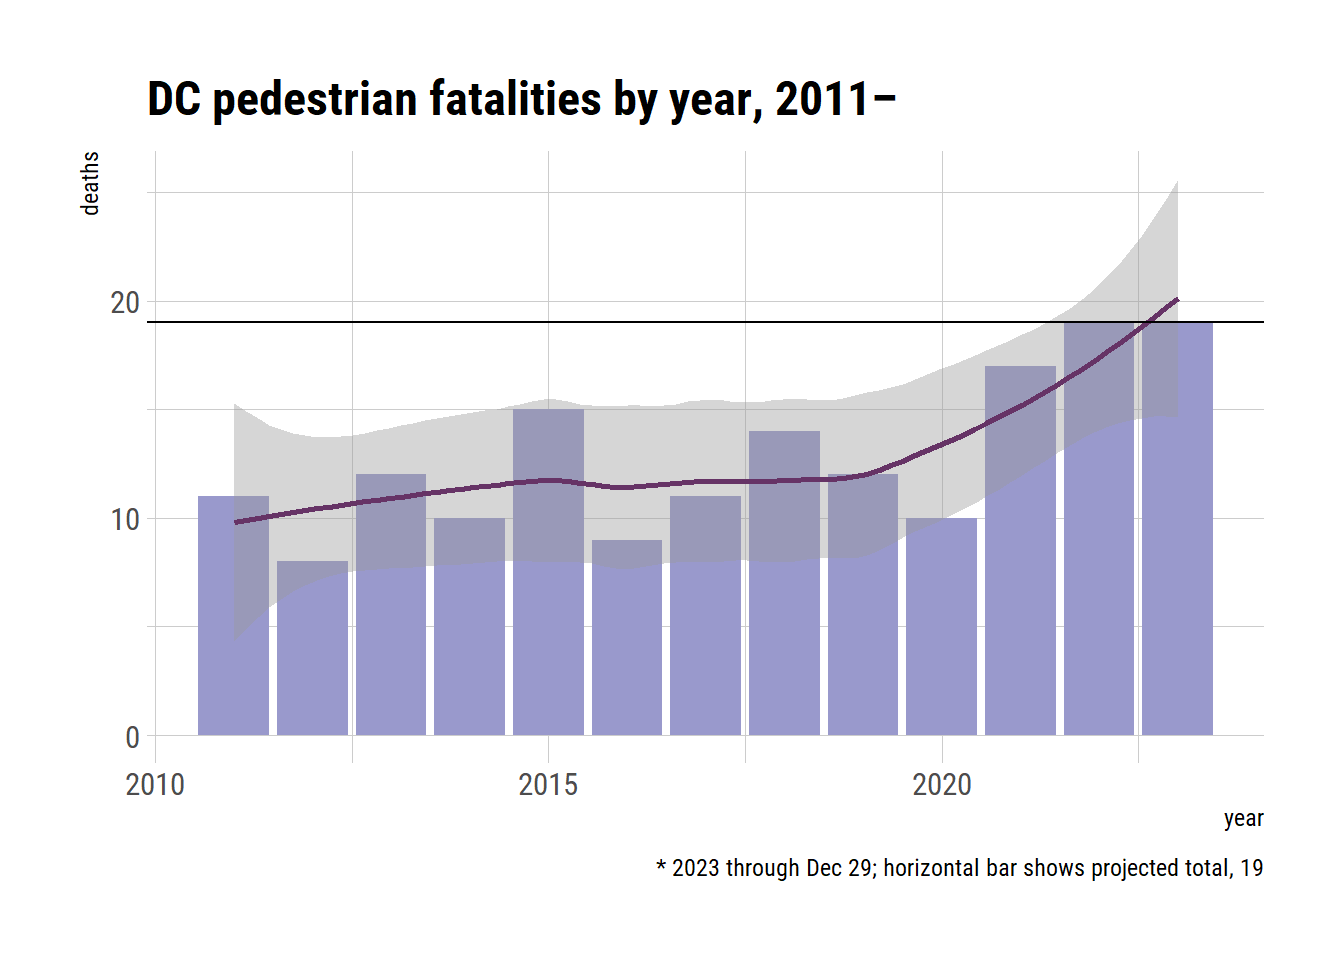
As of Dec 29, there have been 50 fatalities on DC streets this year, of which 19—38.0%—have been pedestrians. Extrapolating to the full year, we should expect to end 2023 with 19 pedestrian fatalities out of a total 50 fatalities.
These totals would be, respectively, the highest number of pedestrian fatalities since by-mode records begin in 2011, and the highest number of total fatalities since 2007, when they briefly leapt to 54 in the midst of a nearly 20-year decline.
As part of the exploratory analysis let’s visualize and summarize the relationship between year, ward, and mode of these fatalities.
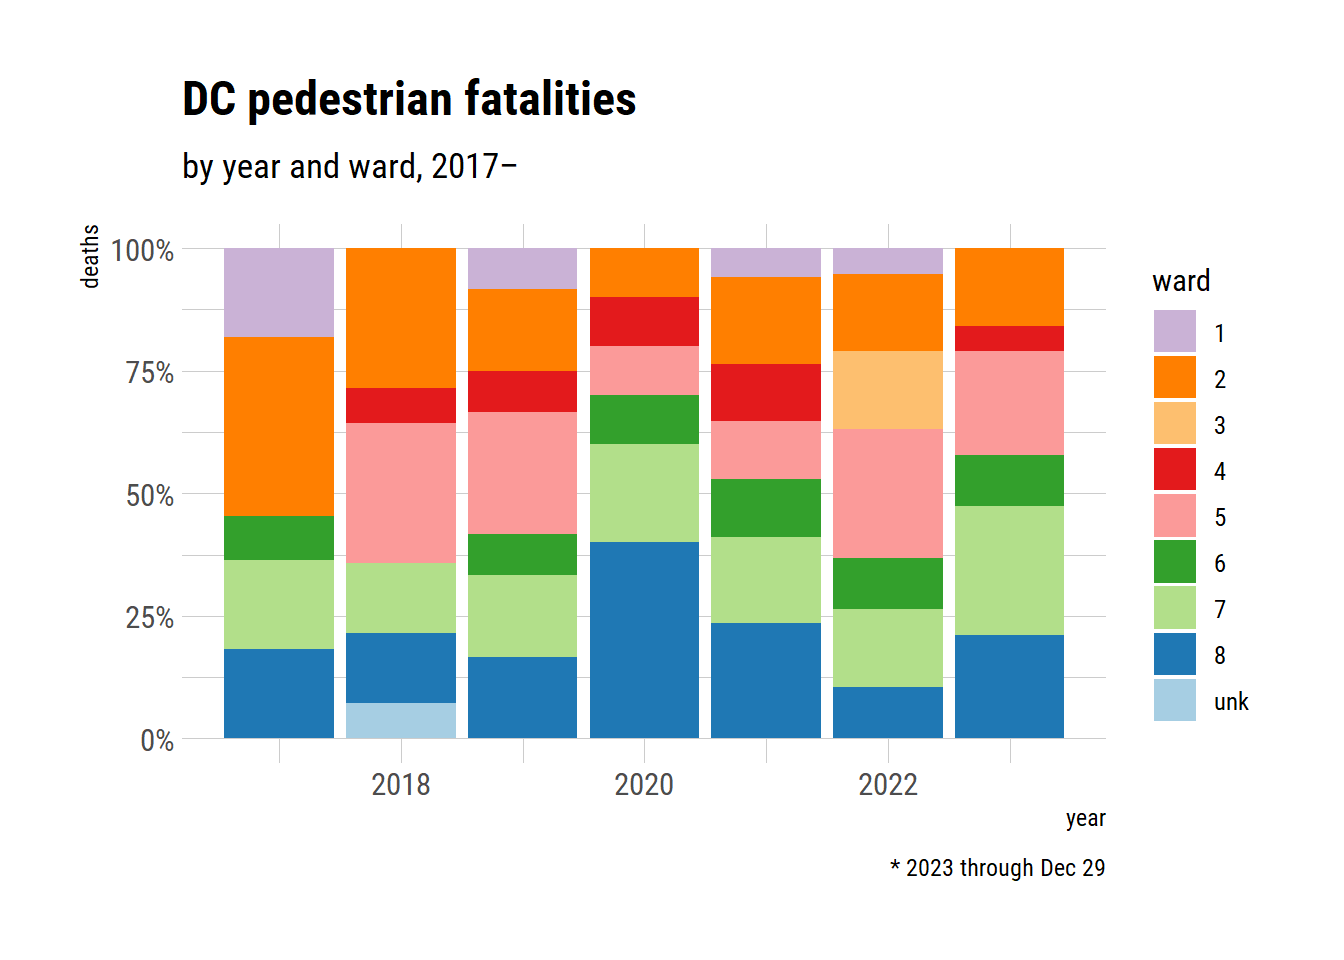
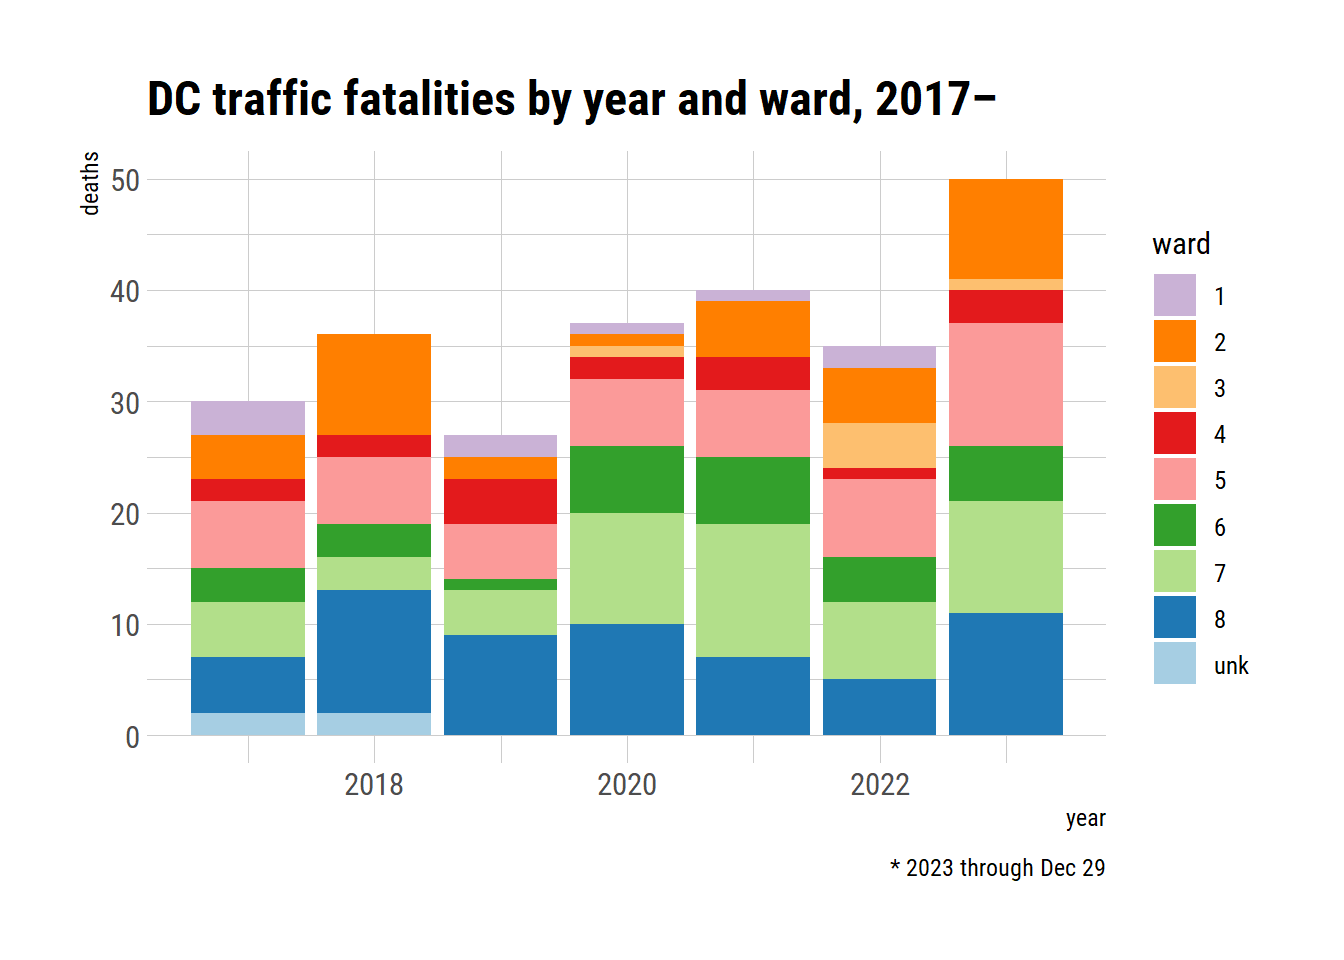
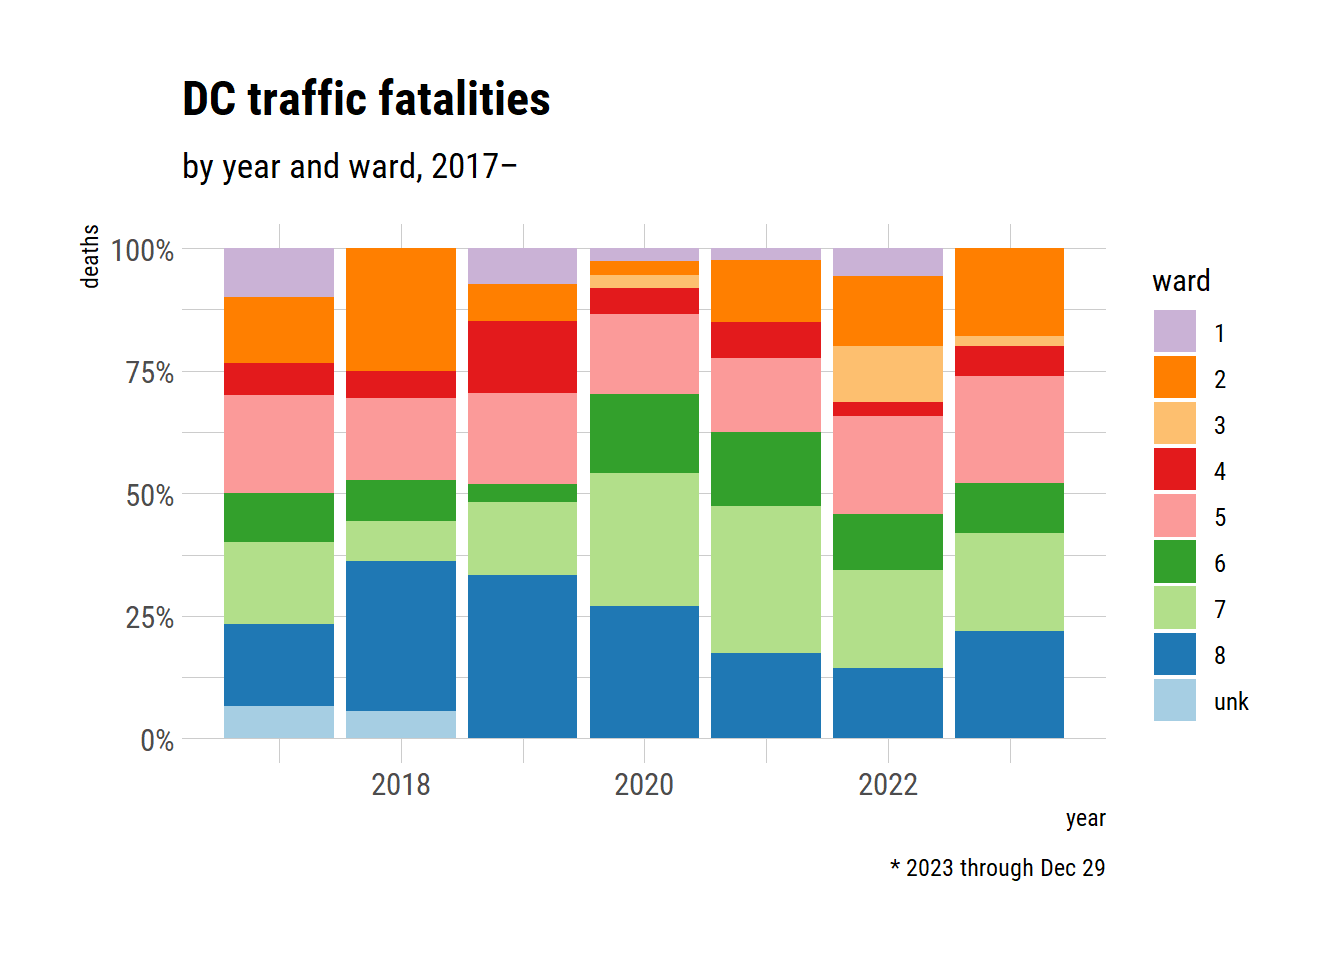
Figure 3 shows four charts, two displaying the distributions of pedestrian fatalities by year and ward and two showing the distribution of all fatalities. Note in both that the vast majority of pedestrian fatalities—indeed, most of all fatalities—occur in the majority-Black eastern areas: Ward 5 (pink), Ward 7 (light green), and Ward 8 (dark blue).
It’s common, especially when looking at large populations, to give fatality rates on a per-capita basis.
# A tibble: 3 × 9
   year drvrs   pax  moto  peds  bike scoot other deaths
  <int> <int> <int> <int> <int> <int> <int> <int>  <int>
1  2000    NA    NA    NA    NA    NA    NA    NA     52
2  2010    NA    NA    NA    NA    NA    NA    NA     25
3  2020    12     7     7    10     1     0     0     37
# A tibble: 13 × 3
year mode deaths
<int> <chr> <int>
1 2011 peds 11
2 2012 peds 8
3 2013 peds 12
4 2014 peds 10
5 2015 peds 15
6 2016 peds 9
7 2017 peds 11
8 2018 peds 14
9 2019 peds 12
10 2020 peds 10
11 2021 peds 17
12 2022 peds 19
13 2023 peds 19[1] 90.89971[1] 41.54736[1] 53.65857[1] 14.50232[1] 21.75348[1] 29.00463